1 Home page
When you access the home page of the database from a browser, you get a screen similar to the following:
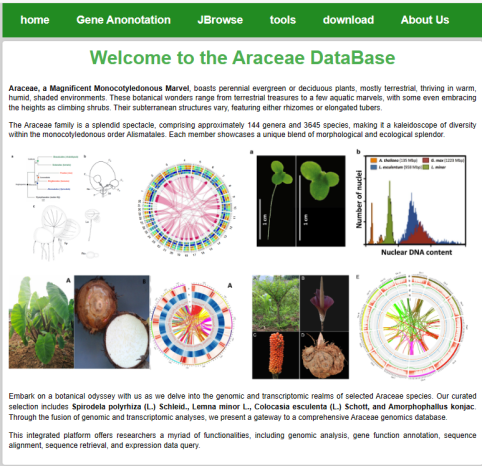
When you access the home page of the database from a browser, you get a screen similar to the following:
Through the top status bar, you can select different interfaces to access different functions, such as gene annotation query, expression query, genome browsing, gene enrichment analysis, co-expression analysis, etc., as shown in the following figure:
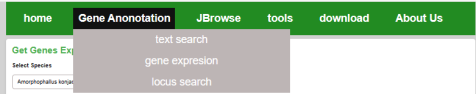
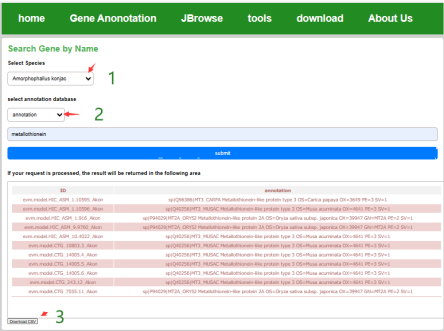
In the Text search interface, the user can select the species, choose the annotation database type, submit it to get a list of related genes, and download the results from the client to the local in the form of a table.
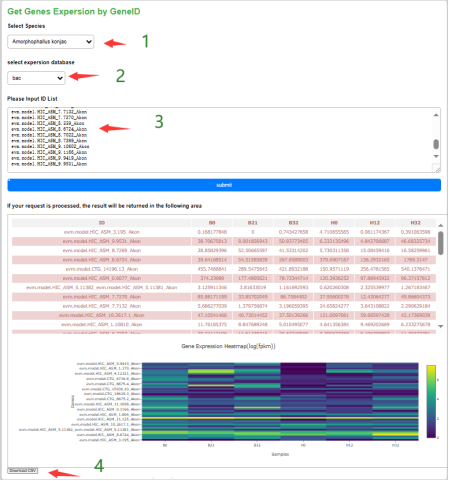
Under the gene expression page, the user can select the species of interest and the expression dataset. After entering the gene ID, the expression matrix of these genes of the species in a certain dataset can be obtained and the expression can be visualized in the form of a heatmap. The user can save the heatmap and download the expression matrix in the form of a table.
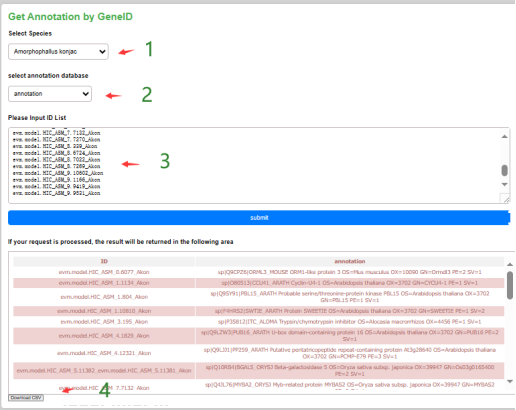
In the locus interface, the user can select the species of the species of interest, as well as the type of gene annotation, submit the list of gene IDs and then submit it to get the annotation information of the gene, and the annotation results can be downloaded locally in the form of a table.
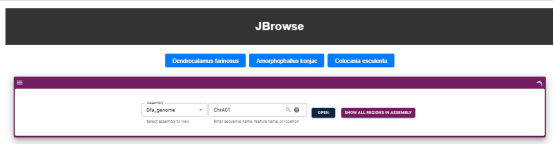
Users can select the genome of the species of interest at the top and browse the genome sequence information, genome structure information and gene structure annotation information and gene sequence information of the species at the bottom.
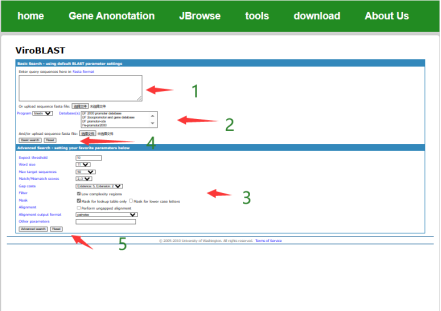
Applying viroBLAST open-source framework, users can perform sequence search and comparison by blast.
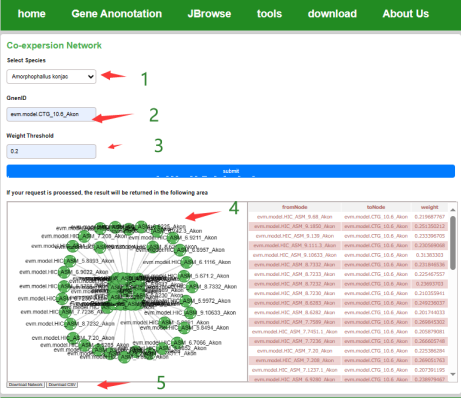
Users can select the species of interest, enter the gene ID and then set the screening threshold and submit it to get the co-expression network diagram of the gene and the co-expression weights of the gene pairs. Users can edit the network, report the error network picture and download it locally in the form of a table.
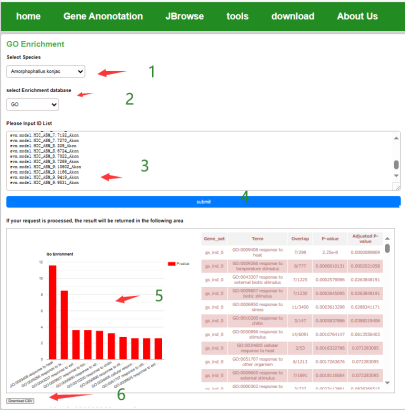
Users can select the species of interest, after the data gene ID list, you can get the GO enrichment analysis results of the gene set, after the end of the analysis, the user can download the enrichment results in the form of images, you can also download the complete GO enrichment results of the situation.
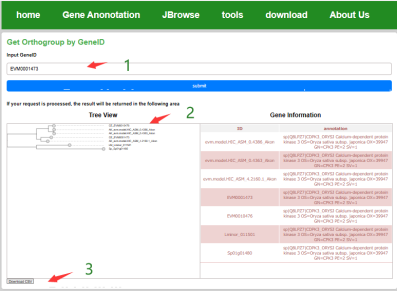
By entering the ID of the gene of interest, the evolutionary tree of the homologous orthologous group of the gene with other species can be queried, gene annotation information, and the user can also download the results in the form of tables and images.
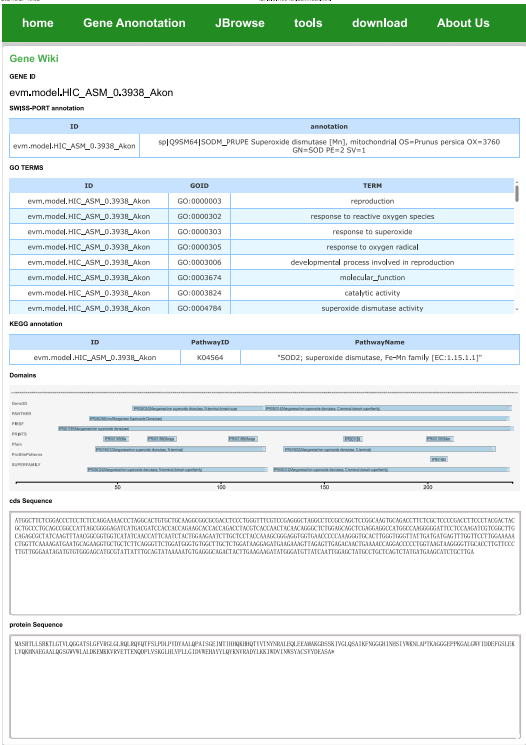
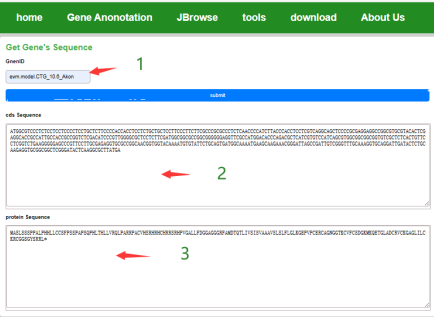
The user inputs the gene ID to get the CDS sequence and protein sequence of the gene.
Detailed information about the gene can be obtained through GID, including GO KEGG uniport annotation, structural domain analysis, and sequence information.